
Macroeconomic Indicators
A list of macroeconomic indicators I personally find interesting and useful to understand the state of the U.S. economy.
Important Indicators
M2 Money Supply
Interpretation
The "M2 Money Supply", also referred to as "M2 Money Stock", is a measure for the amount of currency in circulation. M2 includes M1 (physical cash and checkable deposits) as well as "less liquid money", such as saving bank accounts. The chart below plots the yearly M2 Growth Rate and the Inflation Rate, which is defined as the yearly change in the Consumer Price Index (CPI). When inflation is high, prices for goods and services rise and thus the purchasing power per unit of currency decreases. Historically, M2 has grown along with the economy. However, it has also grown along with Federal Debt to GDP during wars and recessions. In most recent history, M2 growth surpassed 10 percent in the crisis of 2001 and 2009, during which an expansionary monetary policy was deployed by the central bank, including large scale asset purchases. According to Bannister and Forward (2002, page 28), Money supply growth and inflation are inexorably linked.

Source: Long Term Trends. Retrieved: 7 December 2023.
Bank solvency
As of September, 2022, it was revealed that 722 banks reported unrealized losses exceeding 50% of their capital (Source: news.bitcoin.com; see a recent April, 2023 report here). This means that the 7 rate hikes since then (as of August, 2023) occurred while these banks were insolvent and that the bank failures since then were foreseeable. This comes as banks make increasing use of the Discount Window (see chart below) and Bank Term Funding Program, effectively bail-out loan programs.
Net Unrealized Gains (Losses) on Available-for-Sale Securities (DISCONTINUED)
Bank failures
Note that, as of July, 2023, this statistic is already worst than the Great Financial Crisis.

Source: FDIC.
Bank Term Funding Program Asset level
Household Debt and Credit Report
Cumulative debt balances from 2004:Q1 to present.
Credit Cards
Commercial Bank Interest Rate on Credit Card Plans, All Accounts
Banks are significantly tightening lending standards to an all-time high.
Delinquency Rate on Consumer Loans
Delinquency Rate on Credit Card Loans (all and by bank size)
Note that delinquency rates on smaller banks are at an all-time-high since 1991.
Interest Rates
Federal Funds Rate versus 2-year T-bill yield
The federal funds rate, which is controlled, tends to follow the 2-year T-bill yield, which is determined by the market.
Yield Spreads
The current yield curve inverstion, a key leading recession indicator, is now the longest on record (since July, 2022).
Real-Estate
30-year fixed rate mortgage versus 10-year T-bill yield.
Delinquency Rate on Single-Family Residential Mortgages and Commercial Real Estate Loans (Excluding Farmland)
Overnight Reverse Repurchase Agreement
Award Rate
The award rate for banks to effectively store their money with the Federal Reserve overnight.
Usage of the overnight Reverse Repo facility.
Discount Window
Discount Window Primary Credit Rate
Discount Window Usage
Labor Market
Percent of Civilian Labor Force Unemployed 15 Weeks and over (U-1)
Percent change year-over-year:
Trading indicators
- NAAIM Exposure [NAAIM Link]
- US Leading Economic Indicator [Conference-Board Link]
- FedWatch FOMC probabilities(CME Group) [CME Group Link]
Rolex Market Index
The Rolex Market Index is an indicator of the financial performance of Rolex watches on the secondhand market. It is comprised of the top 30 Rolex models by transaction value. The index shows the average market price (in USD) of these 30 watches over time.
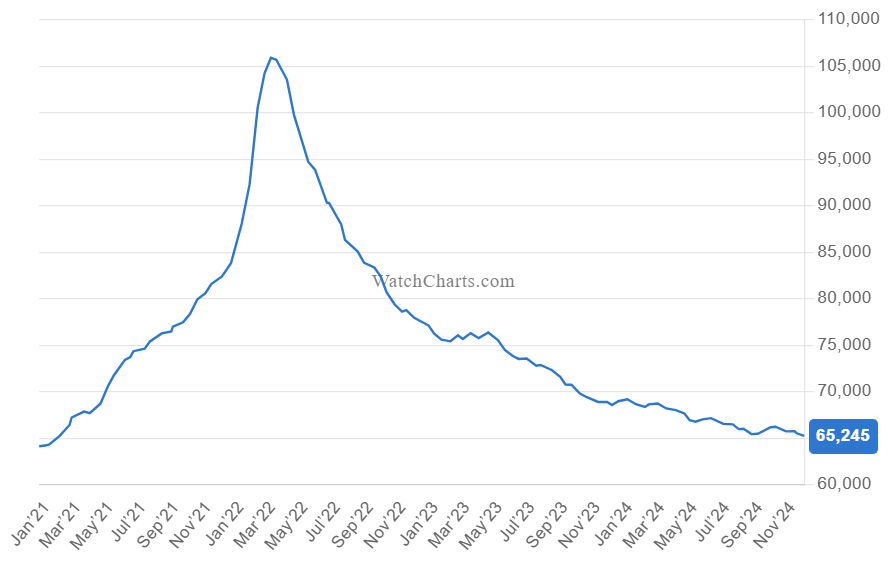
Source: Watch Charts. Retrieved: 9 December 2024.